myBodyGraph

fyi: Variable info in MMI is potentially off… if not more

“the chart discrepancy will be related to our recent Time Zone Database switch, as our chart services recently switched from the ACS Atlas to tzdb. We rely on time zone databases for all time zone boundaries, UTC offsets, and annual information on daylight saving times and dates used to calculate all charts. We used ACS Atlas timezone data for many years but eventually discovered that much of their post-1970 timezone data was not as accurate as we’d hoped. Therefore, we made the change to tzdb which allows the community to suggest edits and which was more accurate than ACS Atlas. Our only goal is to ensure that any chart created using our chart calculator services will use the most accurate timezone data possible, generating the most reliable chart. Regrettably, this comes with rare instances of chart changes.

Time Zone Database (“tzdb”) by IANA is an open-source project, which means anybody can contribute, and individuals have the option to correct mistakes or omissions. All new charts created at MaiaMechanics.com, Jovian Archive, or myBodyGraph use the tzdb for time zone conversion.

All the charts generated using any of our chart calculators (myBodyGraphMaia MechanicsGet Your Chart) as well as the IHDS’, will generate the most up-to-date chart using the new timezone database. The only software still waiting to have the timezone database updated is our desktop MMI Software, which will receive the update shortly.” -Customer Support, Jovian Archive Media

…and should probably read ‘pre-1970’…

In case of doubts go to https://www.timeanddate.com/
They seem to have the exact time zone archives. Then find the location and the year. It gives the exact UTC time. Then make a chart in any software with UTC time.

Reply:

Notice regarding the Source of Time Data and Human Design Chart Calculations | February 20, 2023

Time data refers to the conversion from local time in a particular place—taking into account timezone and Daylight Saving Time (DST)—to UTC (Coordinated Universal Time), which is required to calculate a Human Design Chart. There are approximately 200,000 birth locations worldwide, each of which may be determined geographically or politically—by country, state, county, or town depending on the year.

Concern has recently been expressed about time data in chart calculations. The issue stems from a difference in data provided by official sources, and with this notice we hope to clarify the situation.

MMI for Windows was released in 2004, and has since relied upon the ACS Atlas by Alabe for time data. The ACS Atlas was the most reputable source of time data available at the time, and to this day is used by numerous astrological applications. And while ACS Atlas data is for the most part reliable, based on user feedback and our own investigations, it unfortunately does have its flaws. Most importantly, it is not maintained to a level of degree that provides us with enough confidence for the future.

During the development of our online application, MaiaMechanics.com, we decided to implement the Time Zone Database (TZ) by IANA. TZ is an open source database which is constantly reviewed and updated. We are now confident that TZ data is 100% reliable for birth data calculation since 1970, while pre 1970’s data has only a 1% chance of a faulty result, which we will continue to monitor and refine. For this reason, TZ is the best solution moving forward.

As our focus was on the development of the online application—and on verifying that we were satisfied with TZ data—we did not manage to streamline the shift from ACS Atlas to TZ across all applications simultaneously. We apologize for any troubles this may have caused. Moving forward, MMI for Windows will receive an update to implement TZ, but will be phased out by the end of the year as we focus on continuing development of MaiaMechanics.com. The online application is about to be available in 8 languages and will include a BG5 edition later this month, while DreamRave and the classic BodyGraph will be implemented later this year.

In the meantime:
• Anyone can verify general chart properties and time data using MaiaMechanics.com’s free calculator (find time data from within Properties > Birth Data) or by creating a free account at myBodyGraph.com.
• Until MMI has been converted to TZ, users of MMAI (Advanced Imaging for MMI) are eligible for free access to the Advanced plan of MaiaMechanics.com which allows the creation of Advanced Imaging charts using TZ data. Create your account now and then contact us for free access (please include the email address of your Jovian account to verify MMAI ownership, and the email address you used to sign up at MaiaMechanics.com)

Loki S. Krakower-Riley
Jacqueline Riley
Co-directors, Jovian Archive Media Pte. Ltd.
MoonBlog 54.6 Selectivity

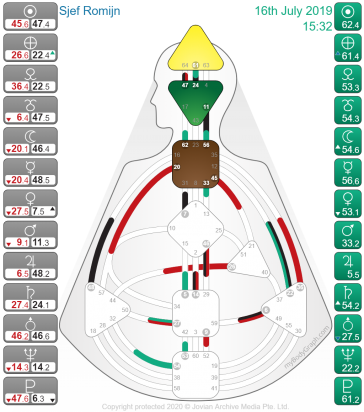
MoonBlog 54.6 exalted in ‘Three Activations’ View

As someone who is in the experiment well over 11 years, and providing my own Transit/Lunar Cycle service, I find the Transit Tool provided by myBodyGraph very advanced, very elaborate too. Maybe even too advanced for beginners.

However, there is so much functionality in it, some obvious by just clicking here and there, some perhaps not so obvious.

So is it for beginners? Yes and no, for some it will be an online honey pot and resource of incredible information, for others it might be a nerd fest of overwhelm.

At the same time, the information that is provided, like all Retrograde Planets, and when they start or end doing so, and other statistics, the live view is fascinating.

Over time one will use a few key functions I presume, you may gravitate towards some different ones than I would, and because it is so elaborate and vast this is all possible.

When having access to Steps 2 and 3 on just one chart, but then not having that same access in the Transit Tool is unfortunate and only overcome by buying the unlimited access.

My Transit Cycle Sequence in full

And sometimes I end up in another information layer I need to remind myself to click the exit cross on the right and come back to the big overview of menus again, where I can then play again with which information to show:
Themes, keynotes and Lines under Planetary Activations
Keynotes, Not-Self Keynotes, Not-Self Questions under Centers
Keynotes under Channels
Elaborate Ordering options under Gates
The many, many ‘hover mouse over’ information baloons

And once activating some of the many options in the ‘show’ menu under the Moon Cycle, another vast bank of info opens up to play with, which I enjoy very much, which I can imagine any beginner struggling with, but starting out with selecting and deselecting which options to show, may help there indeed.

The Ephemeris part did not phase me that much, but can imagine other people have a field day looking forwards or back to certain events, although limited to the years 1900 – 2060. Ok I tried actually and got from December 31st 1899 until May 30st of 2061 😉

Add on: What is odd to me and may confuse others, is the use of the blue and green color. In the MMI, when making a Transit Chart, what is Resonant or you, becomes Green and what forms a Channel (Harmonic) is Blue. In this tool it is the other way around. Luckily there is also the Three Activations view, where the Red & Black of your own chart remain intact and Transits are Green, as seen in the picture top right.

Do check out the descriptions and screenshots here: https://www.mybodygraph.com/shop/product/transit-tool before buying, to see if it tickles you funny, or perhaps not.

A big thanks to Pontus Erik Karlsson (5/1 Reflector) from https://www.thekeytoyourself.com for being paramount in the idea, development and implementation of this online resource.
Read more

Know yourself

myBodyGraph

“The purpose of Human Design is to show our uniqueness. Your Human Design BodyGraph reveals your Definition (who you are) and your Openness (who you think you are and the source of your conditioning).

The first step in being yourself is to rely on your definition and experiment with your Strategy and Authority. The next step in Human Design is to see what is open in you and recognize where you have been conditioned.

The reward that comes from recognizing our own nature is worth the effort. Knowing and understanding our Design protects us from being a victim of our conditioning. To be ourselves is fundamentally to be healthy.

To be what we are not—to live the conditioning—leads to disease as we continually confront ourselves with energies we are not genetically equipped to handle. Human Design is a tool that can help us understand how our body is designed and how it is meant to run properly.” myBodygraph.com

The Talking BodyGraph

MyBodyGraph

The First interactive Human Design BodyGraph interpretation service. It’s the step-by-step user manual for your life. Sign up and start learning about yourself, the first step is free. (click the picture)

What is the Talking BodyGraph?
The Talking BodyGraph is the first interactive Human Design BodyGraph interpretation service. It provides a step-by-step analysis of a BodyGraph, with instant access to audio and text material. All audio material is voiced by Ra Uru Hu, the founder and first teacher of the Human Design System.

MoonBlog 32.1

The Human Design System Testimonials

Jovian Archive is working on a new and exciting project for newcomers and long-time professionals alike, one that provides a service to all students of Human Design.

The collective has a tendency to resist the type of knowledge that Human Design represents; amid public skepticism, people are often unwilling to give such methods a chance. This is where you can help us.

Testimonials are key to highlighting the value of the Human Design System to newcomers across the globe.
Read more